
Summit Restoration Team · 6 min read
Northern Virginia experiences some pretty powerful weather, thanks in part to storms coming in off the coast. NoVA homeowners have been impacted by flash floods, derechos, and even tropical storms and tornadoes. As Northern Virginia continues to develop, property owners need to be prepared for whatever kind of weather rolls through the area.
To find out just how often NoVA gets hit by storms and other adverse weather events, Summit Restoration gathered data from the FEMA National Risk Index and the National Oceanic and Atmospheric Administration (NOAA) Storm Events List to determine which parts of Northern Virginia are most at risk. Between Loudoun County, Fairfax, Prince William, Arlington, and Fauquier, a few counties carry higher risk for storm-related damage than others. When all it takes is one storm to damage your property, NoVA residents need to know what kind of risks they’re facing.
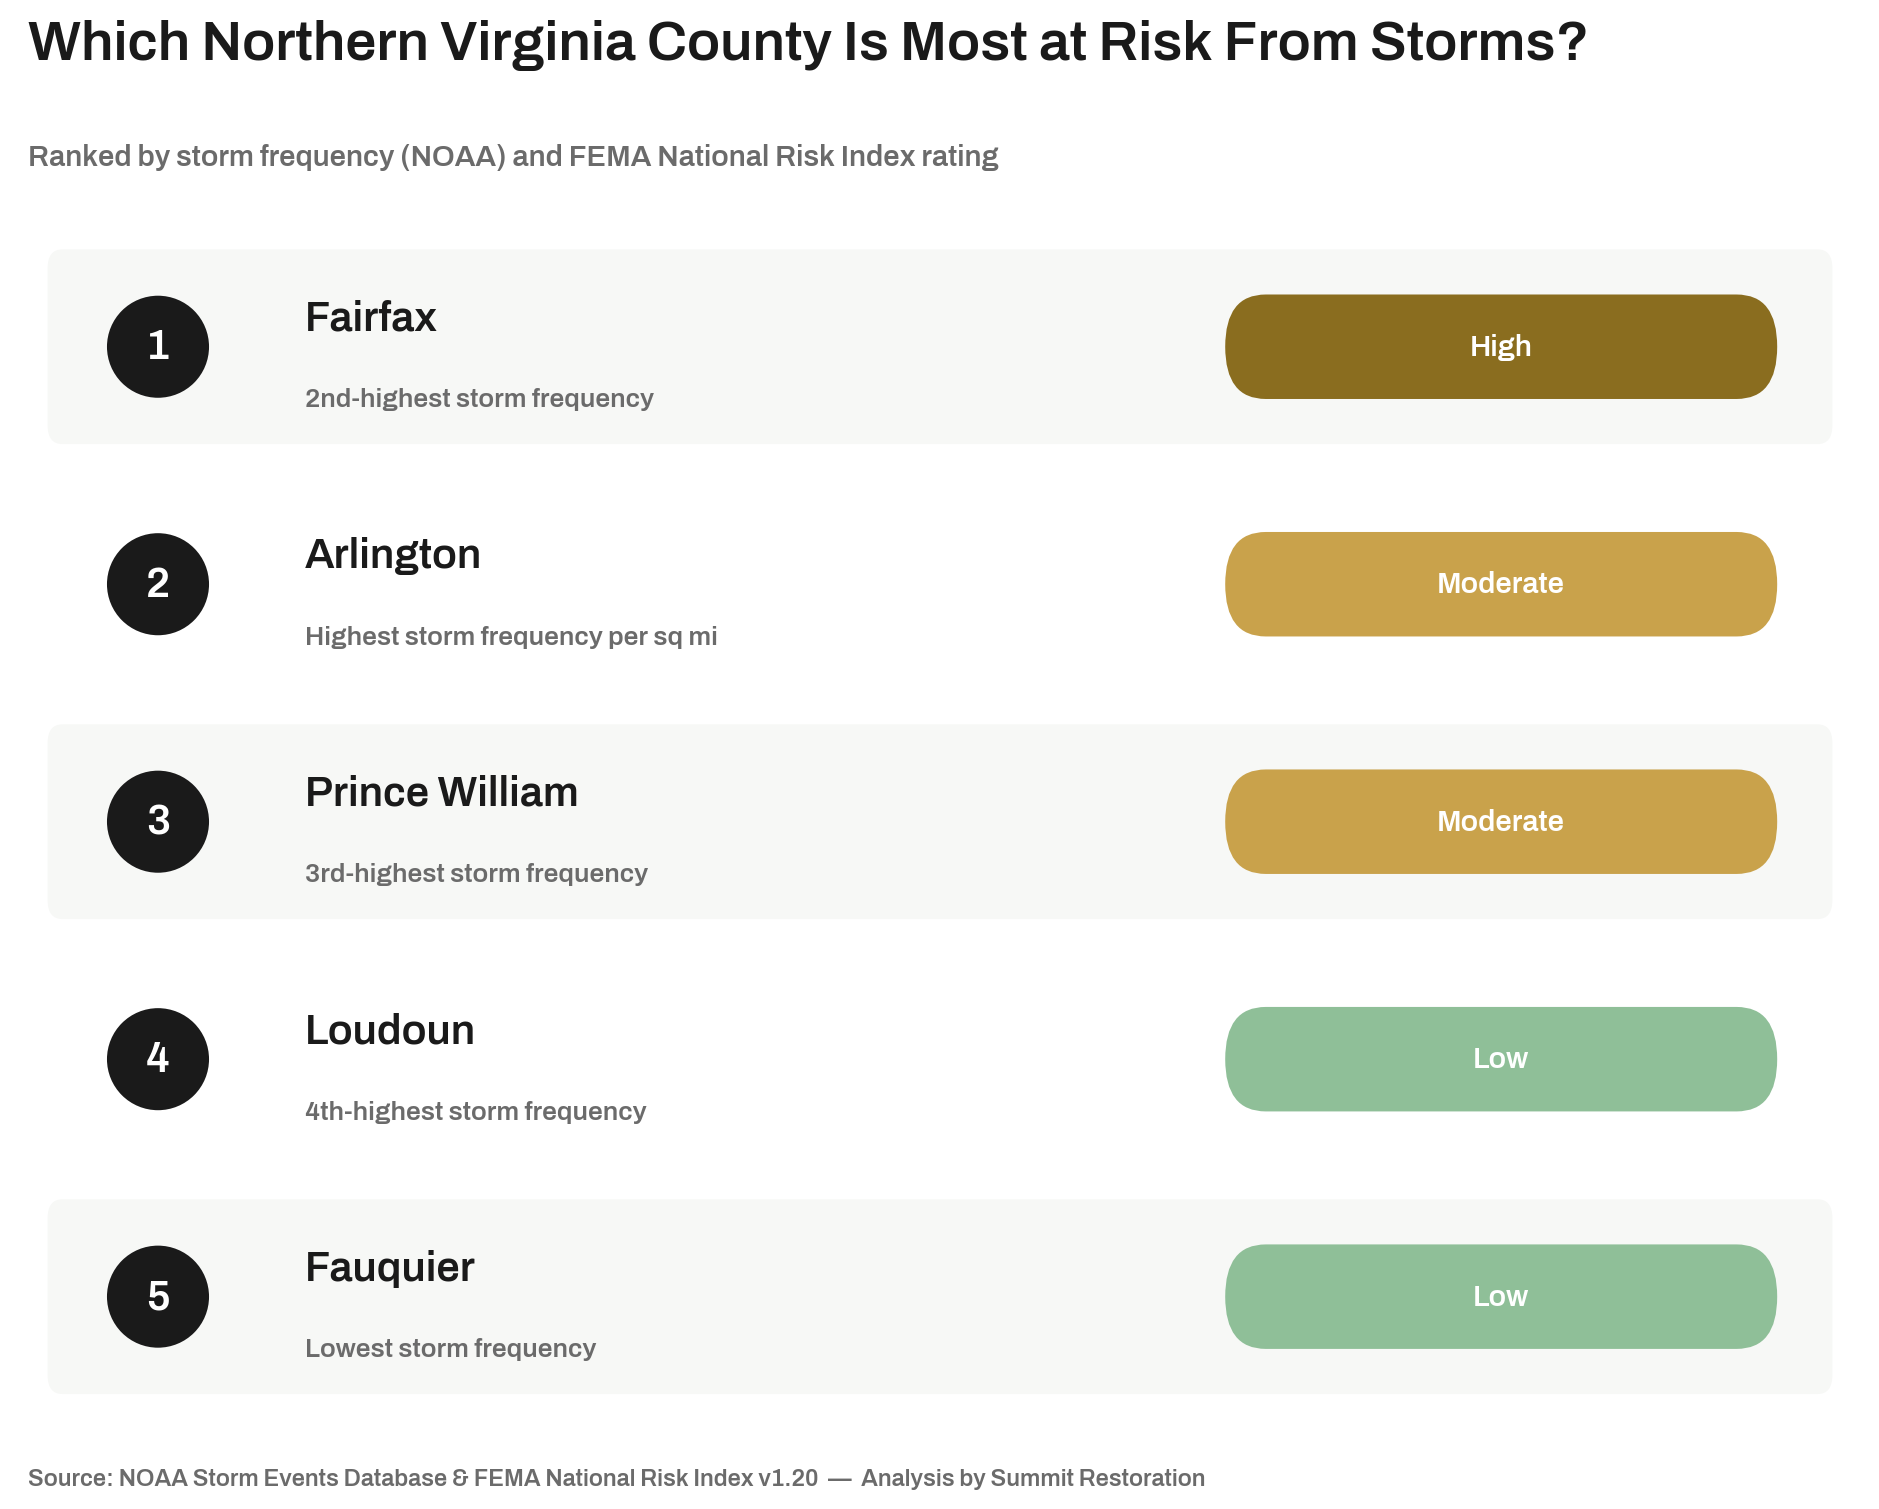
By blending the data from FEMA’s National Risk Index and NOAA, we found which NoVA counties experience the most storms. Fairfax leads, with the second-highest storm frequency per square mile and the highest risk of damage from storms. Because Fairfax has the highest population and building density of any NoVA county, their FEMA hazard risk is the highest, as one severe weather event could wreak havoc on a large portion of the population.
Conversely, due to its small size, Arlington has the most storms per square mile. This pushed them into a moderate blended risk zone, as their population density means that storms can affect almost the entirety of the county. Prince William County is at moderate risk due not only to the frequency of storms, but the systems put in place to recover from the damage they cause. FEMA gave Prince William County the lowest “community resilience” score of any NoVA county, meaning they would have to work hardest to rebuild.
Loudoun and Fauquier counties, with the lowest storm frequencies and most positive FEMA rankings, have low risk of permanent damage from weather events. Their community resilience and stable population growth make them the least likely to be negatively impacted by adverse weather.
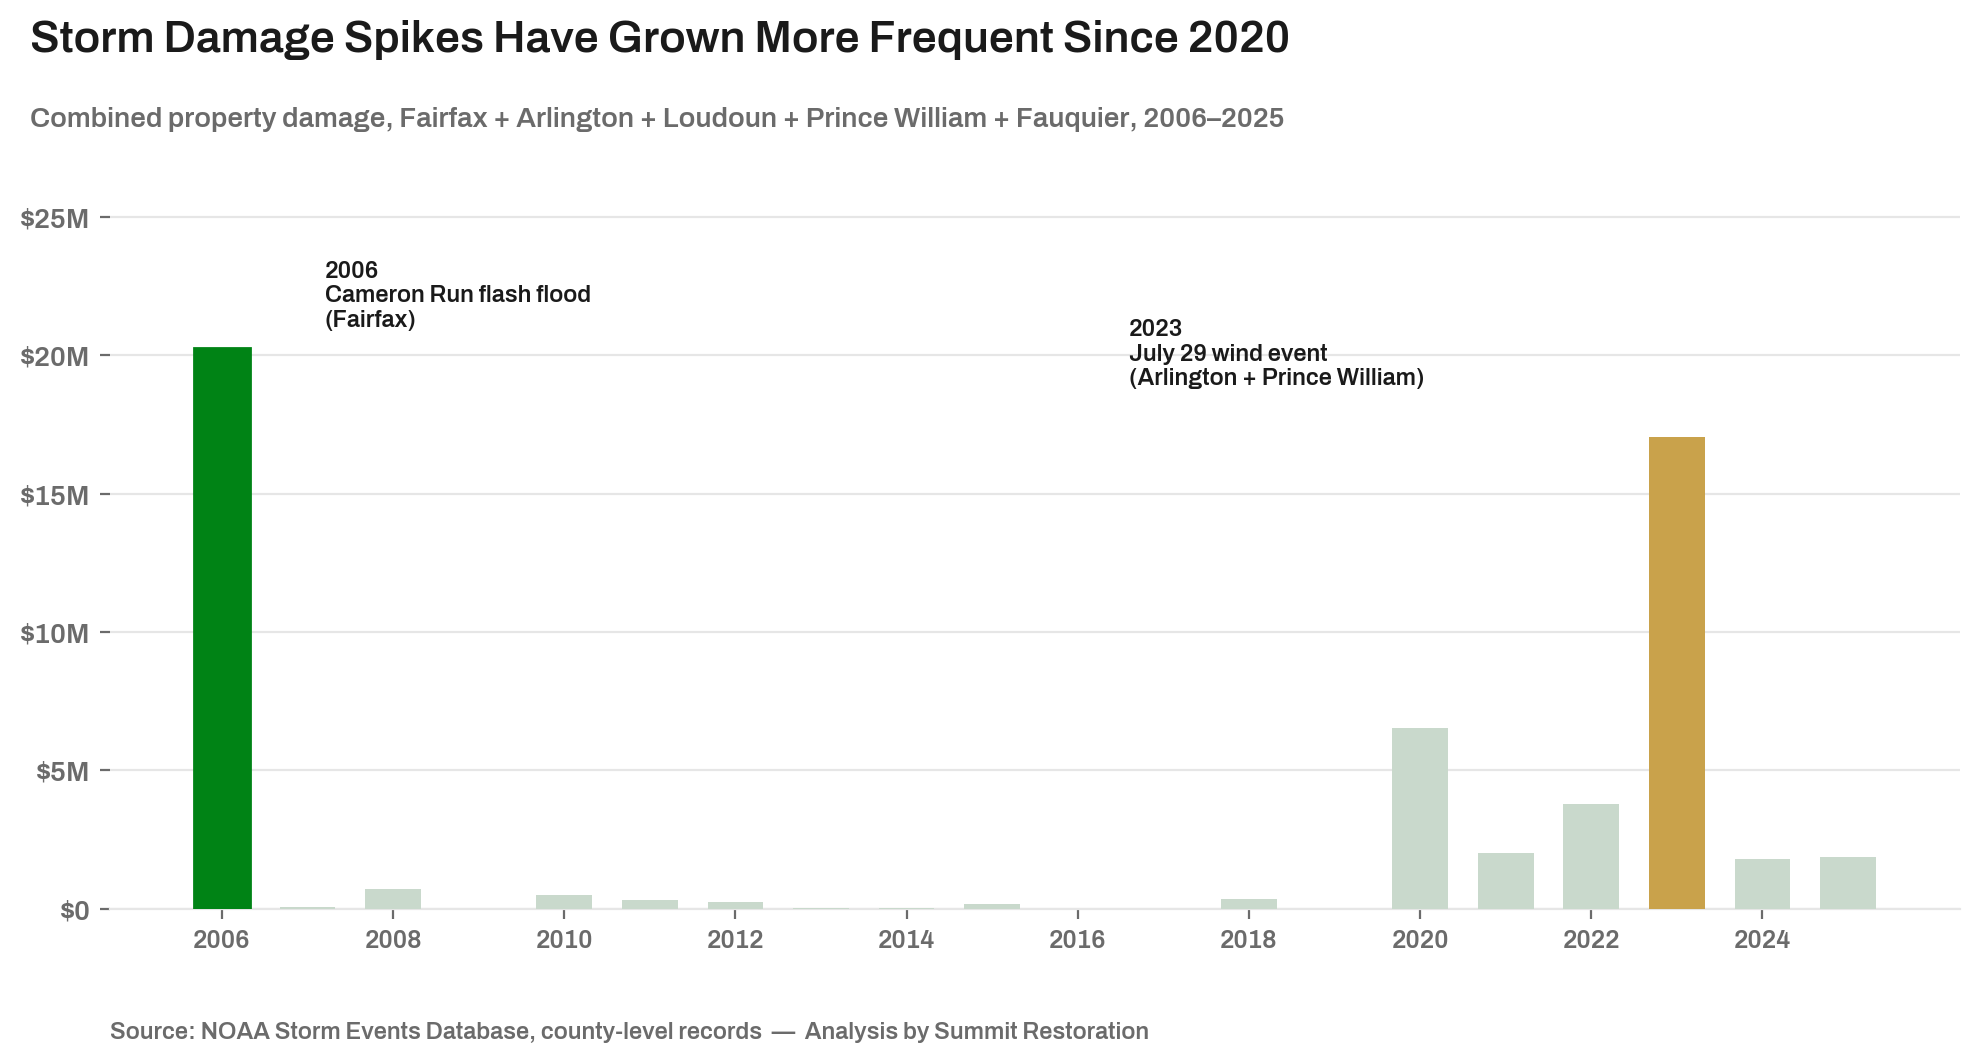
The data shows a clear trend: storms are happening more often than they used to. Combined storm events across all five counties averaged 142.8 per year between 2016 and 2025, up from 117.6 per year in the decade before. This is a roughly 21% increase. The past five years have been especially eventful: 2021 through 2025 averaged 180.6 storm events per year, nearly double the 91 events per year recorded between 2006 and 2010. Some of that rise reflects better weather monitoring and reporting technology over the past two decades, but the scale and consistency of the increase point to more than just improved detection.
This spike is part of a larger pattern. High-frequency storm years (150+ events region-wide) happened in six of the past ten years, up from just four in the first ten years we tracked. The damage these storms cause is getting more expensive, as well. Two of the three highest combined-damage years on record were 2020 and 2023, showing how one bad year can cost property owners thousands. Having a team that’s able to rebuild and restore makes all the difference after a catastrophic storm.
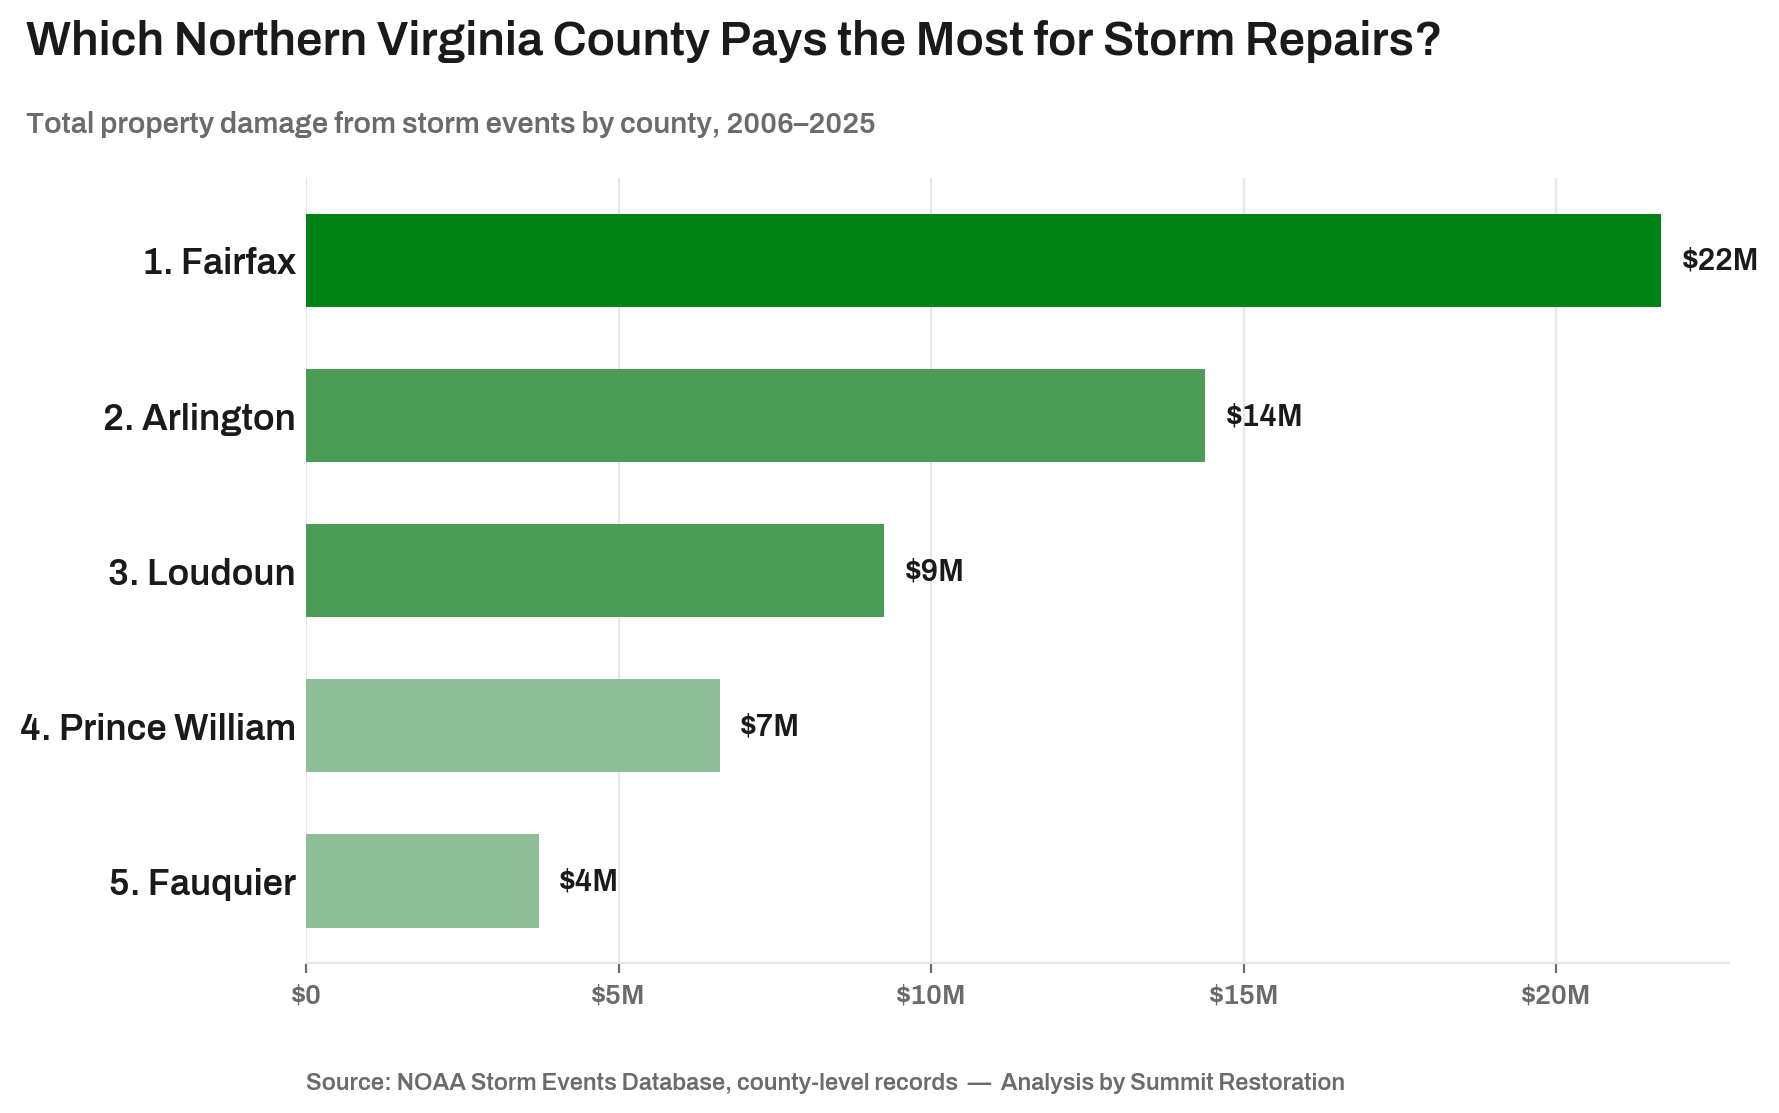
Fairfax has paid the most for weather damage in the last twenty years – but half of their spending went toward one event. In June 2006, the Cameron Run flash flood rendered 158 Fairfax homes uninhabitable, and cost the county $11 million dollars in repairs. The same storm system caused a similar flash flood in Arlington, costing the county $3 million in repairs. Days later, on July 2nd, a microburst storm caused another $5 million in damage to Fairfax County, marking 2006 as a particularly unlucky year.
Arlington had a similarly unlucky day in 2023 – one that accounted for the majority of their spending. On July 29, 2023, a derecho wind storm caused $10 million in damage to Arlington, even resulting in one fatality. The same storm caused $4.25 million of damage to Prince William County, accounting for more than half of their spending.
These isolated events prove that catastrophic damage can strike in a day, and cause damage that is still being repaired decades later. Northern Virginia homeowners should use this data to think about storm preparedness, and make a plan for who they’ll call if the worst weather hits.
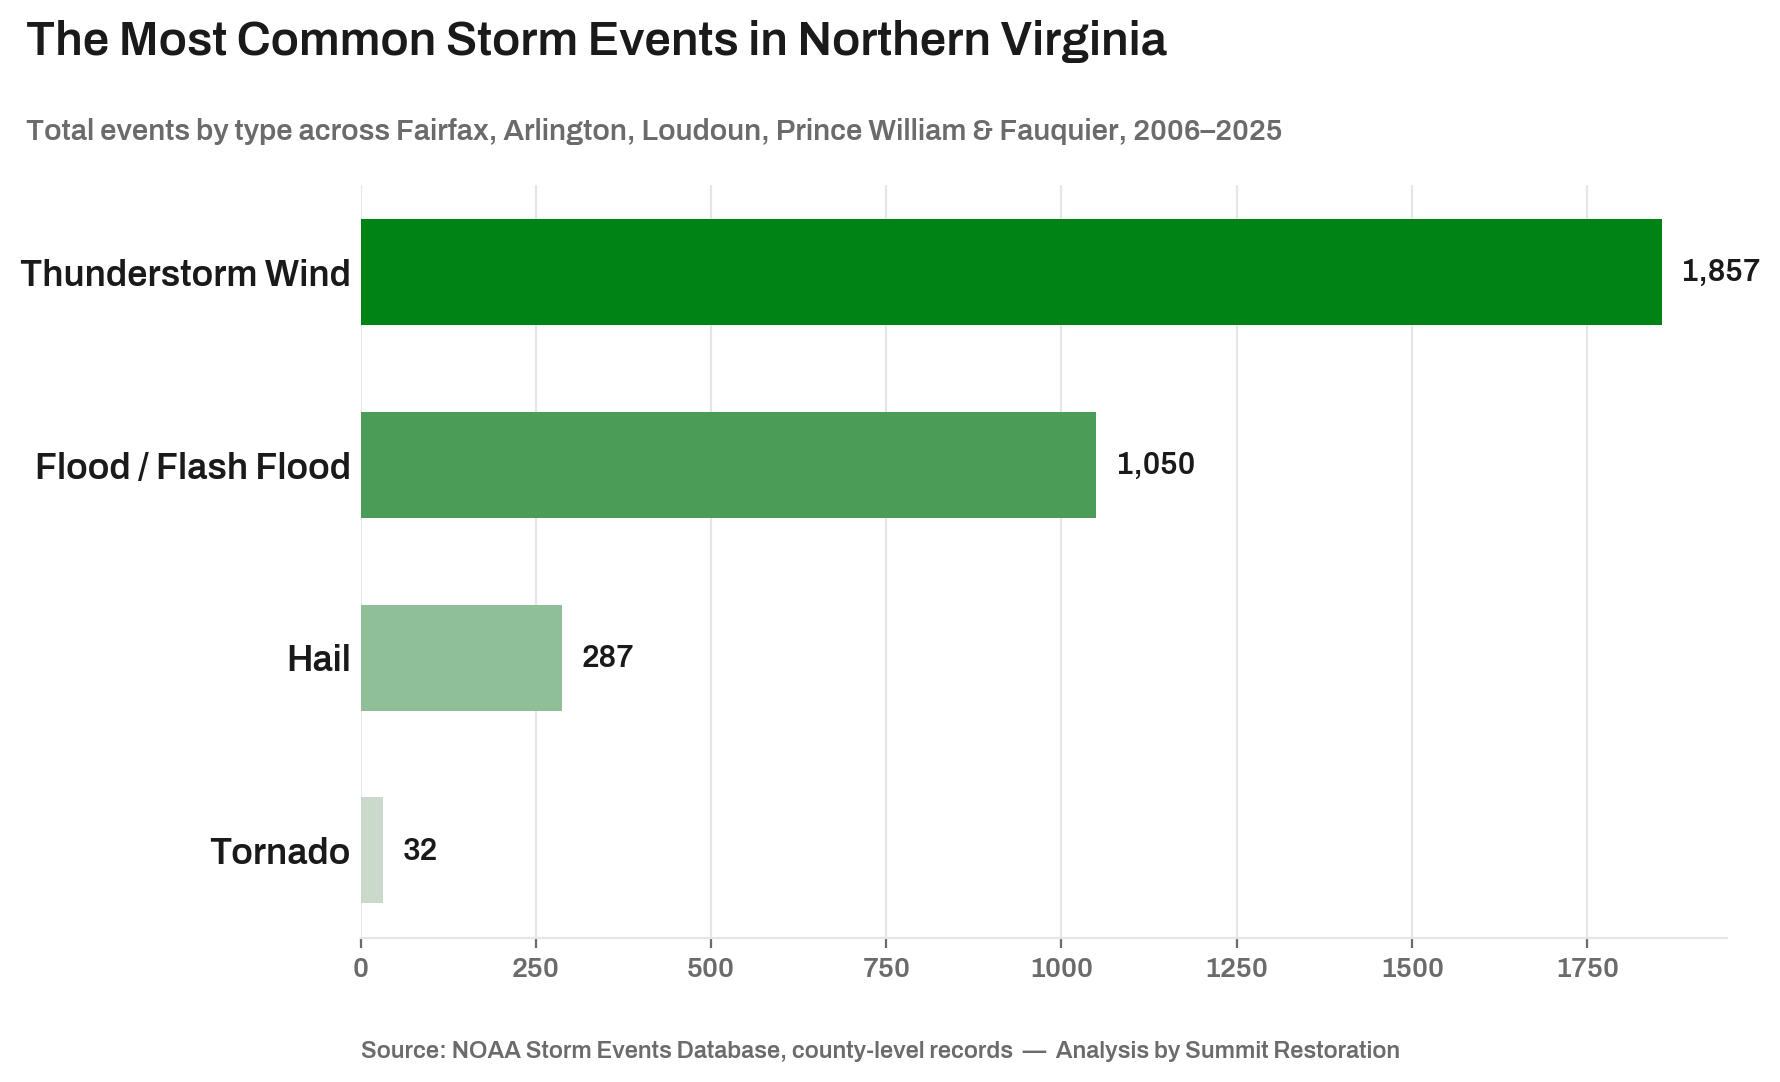
Across Northern Virginia, one hazard dominates the record book: thunderstorm wind. There were 1,857 events over the past 20 years — more than every other storm type combined. Flooding and flash flooding followed behind with 1,050 events, followed by hail at 287. Tornadoes are by far the rarest storm, with just 32 recorded across two decades. However, they’re the most capable of delivering outsized damage in a single strike.
Not every county experiences these equally. Fairfax experiences the most thunderstorm wind and flooding, logging 581 thunderstorm wind events and 489 flood or flash flood events. That combination lines up with Fairfax’s FEMA hazard scores, which rank it highest of the five counties for inland flooding, strong wind, and hurricane-force wind.
Loudoun County stands out for a different reason: hail and tornadoes. It recorded 101 hail events over the past two decades, the most of any county in the region, and is also more at risk for tornadoes. That risk became reality on February 7, 2020, when a tornado tore through Loudoun and caused $5.78 million in damage. Prince William County is even more vulnerable to tornadoes when they do happen, according to FEMA’s hazard score, so residents of these counties need to be ready in case a tornado does blow through town.
Storm risk in Northern Virginia isn’t static, and treating it that way is what leaves homeowners and property managers unprepared. A county’s risk level is due to a mix of population growth, building density, and hazard exposure — all of which shift as the region develops. That’s why relying on good weather is riskier than it looks: the data shows both storm frequency and damage costs have climbed steadily over the past two decades, and it shows no sign of reversing. For homeowners, insurers, and property managers alike, the value of this kind of data isn’t in knowing who’s “worst off”, it’s in knowing that your storm preparedness plan needs to be flexible.
For homeowners and property managers across Northern Virginia, this data points to a simple takeaway: storm risk isn’t evenly distributed, but no county is exempt from it. Regular maintenance checks on roofs, gutters, and drainage systems, an up-to-date review of homeowner’s or property insurance coverage, and a plan for who to call when damage happens can turn a costly, drawn-out recovery into a manageable one — which is exactly the kind of restoration readiness Summit VA specializes in.
This analysis drew on two independent data sources. Storm event and damage figures came from NOAA’s National Centers for Environmental Information (NCEI) Storm Events Database, and built a set of county-level records for Thunderstorm Wind, Flood, Flash Flood, Hail, and Tornado events, covering Fairfax, Loudoun, Prince William, Arlington, and Fauquier counties from 2006 through 2025. To account for the fact that a small county will naturally register more events per square mile than a large one, raw event and damage totals were also normalized by each county’s land area, producing events-per-square-mile and damage-per-square-mile figures. We layered in FEMA’s National Risk Index (v1.20, December 2025), which provided a modeled composite risk score and per-hazard risk scores for each county based on expected annual loss, social vulnerability, and community resilience. The final blended risk rank presented in this piece was the average of each county’s NOAA-based rank and its FEMA-based rank, combining real-world storm frequency with FEMA’s modeled risk assessment into a single measure.
This data and any accompanying graphics may be reused for noncommercial purposes with a link back to this article as the original source.